
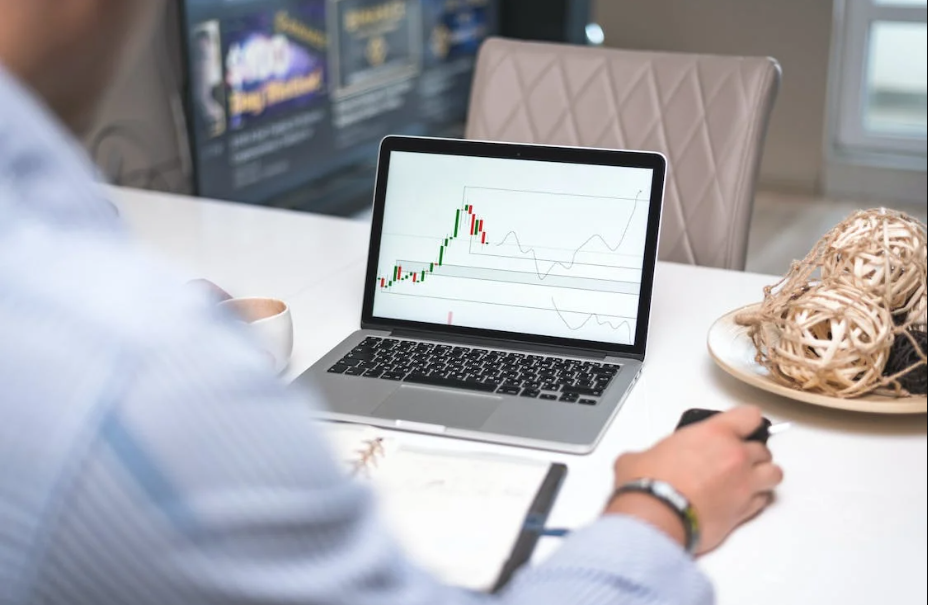
Cryptocurrency trading has become increasingly popular, and for anyone venturing into this exciting world, understanding how to read crypto charts is an indispensable skill. At HelloCrypto, we recognize the significance of chart analysis in making informed trading decisions. In this guide on reading crypto charts, we’ll explore the essentials of reading crypto charts, delve into various chart types, decipher candlestick patterns, and provide valuable insights to elevate your trading game.
Table of Contents
Basic Elements of Crypto Charts
Candlesticks
Candlesticks are graphical representations of price movements within a specified time period on a crypto chart. Each candlestick typically consists of a body and wicks, with the body representing the opening and closing prices and the wicks indicating the highest and lowest prices during that timeframe. Traders analyze candlestick patterns to gain insights into market sentiment, such as bullish, bearish, or indecisive conditions, aiding in decision-making and trend prediction.
Timeframes
Crypto charts offer a range of timeframes, including short-term (e.g., minutes), medium-term (e.g., hours or days), and long-term (e.g., weeks or months). Different timeframes provide varying perspectives on price movements, allowing traders to adapt their strategies accordingly. Short-term timeframes are useful for intraday trading, while longer timeframes are employed for trend analysis and strategic planning.
Price Trends
Identifying and understanding price trends is crucial for successful crypto trading. Trends can be upward (bullish), downward (bearish), or sideways (neutral). Traders use trendlines, moving averages, and other technical indicators to recognize and confirm trends. Recognizing trends early enables traders to make informed decisions, whether it involves entering or exiting a position, setting stop-loss orders, or adjusting their trading strategy based on the prevailing market conditions.
Volume
Volume refers to the number of tokens or coins traded during a specific time period. Analyzing volume provides insights into the strength and validity of a price movement. High volume during an uptrend or downtrend confirms the trend’s strength, while low volume during a price change may suggest a potential reversal or weakening trend. Traders often use volume analysis in conjunction with other technical indicators to validate their trading decisions and gain a comprehensive understanding of market dynamics.

Reading Candlestick Patterns
Bullish Patterns
Bullish candlestick patterns are crucial for identifying potential upward trends in financial markets, providing traders with valuable buying opportunities. One common bullish pattern is the “Bullish Engulfing” pattern, where a small bearish candle is followed by a larger bullish candle that completely engulfs the previous one. Another notable pattern is the “Hammer,” characterized by a small body near the top of the candle and a long lower wick, indicating potential bullish reversal. Recognizing these patterns enables traders to make informed decisions on when to enter the market, capitalizing on the anticipated upward movements.
Bearish Patterns
Bearish candlestick patterns play a pivotal role in helping traders anticipate and navigate downward trends effectively. The “Bearish Engulfing” pattern, opposite to its bullish counterpart, occurs when a small bullish candle is followed by a larger bearish candle, signaling a potential reversal to the downside. Additionally, the “Shooting Star” pattern is indicative of a potential bearish reversal, featuring a small body near the bottom of the candle and a long upper wick. By identifying these bearish patterns, traders can strategically plan their selling positions and protect their investments during market downturns.
Reversal Patterns
Understanding reversal patterns is essential for predicting changes in market trends and adjusting trading strategies accordingly. The “Double Top” pattern is a classic reversal formation, occurring when an asset’s price reaches a peak twice, with a valley in between, suggesting a potential trend reversal from bullish to bearish. Conversely, the “Double Bottom” pattern signifies a shift from bearish to bullish trends, characterized by two consecutive troughs separated by a peak. Traders who can recognize these reversal patterns gain a significant advantage in adapting their strategies to changing market conditions, enhancing their overall success in financial markets.
Understanding Technical Indicators
Moving Averages
Moving averages are a widely used technical indicator in financial markets. They help smooth out price fluctuations over a specified period, revealing the underlying trend of an asset. Simple Moving Averages (SMA) and Exponential Moving Averages (EMA) are the two main types. SMA gives equal weight to all data points, while EMA assigns more weight to recent prices.
Relative Strength Index (RSI)
RSI is a momentum oscillator that measures the speed and change of price movements. RSI values range from 0 to 100, with readings above 70 suggesting overbought conditions and readings below 30 indicating oversold conditions. Traders use RSI to identify potential trend reversals and assess the likelihood of a security being overvalued or undervalued.
MACD (Moving Average Convergence Divergence)
MACD is a versatile indicator that combines aspects of trend-following and momentum indicators. It consists of two lines—the MACD line and the signal line—derived from the differences between two moving averages. Traders look for MACD crossovers, where the MACD line crosses above or below the signal line, to identify potential trend reversals. Additionally, the histogram generated by the MACD visually represents the difference between the MACD line and the signal line, providing insights into the strength of a current trend.
Real-time Chart Analysis
Live Trading Scenarios
In live trading scenarios, practitioners implement their strategies based on real-time chart analysis. This could involve executing buy or sell orders, setting stop-loss levels, and managing trades as market conditions evolve. An example might be a day trader recognizing a breakout pattern on an intraday chart and deciding to enter a quick trade to capitalize on the anticipated price movement.
Making Informed Decisions
Understanding chart patterns empowers traders to make informed decisions by recognizing recurring formations that often precede specific market movements. For instance, recognizing a double top pattern on a daily chart might lead a trader to anticipate a potential trend reversal and adjust their strategy accordingly, either by closing existing positions or opening new ones in the opposite direction.
Risk Management
Incorporating risk management strategies is vital for safeguarding trading capital. Traders may use techniques like setting stop-loss orders, diversifying their portfolio, and calculating position sizes based on risk tolerance. For instance, a trader employing a 2% risk per trade might adjust their position size to reflect this, ensuring that potential losses are controlled even in volatile market conditions. Effective risk management is integral to long-term trading success.
Common Mistakes to Avoid
Overtrading
Overtrading refers to the excessive buying and selling of financial instruments within a short period. This mistake often stems from the desire to capitalize on every market movement, leading to increased transaction costs and potential losses. Traders may neglect proper risk management and trade impulsively, driven by the fear of missing out (FOMO) on profit opportunities. It’s crucial to establish a well-defined trading strategy, set realistic goals, and exercise discipline to avoid falling into the trap of overtrading.
Ignoring Fundamental Analysis
While technical analysis involves studying price charts and patterns, fundamental analysis delves into the underlying factors that influence an asset’s value. Neglecting fundamental analysis means overlooking critical information about a company or market, such as economic indicators, financial reports, and geopolitical events. Successful trading requires a comprehensive approach that incorporates both technical and fundamental analyses to make informed decisions.
Emotional Decision Making
Emotional decision-making can have detrimental effects on trading outcomes. Fear and greed are common emotions that can cloud judgment, leading to impulsive actions. Traders might panic sell during market downturns or make irrational decisions driven by excitement during periods of rapid gains. Developing emotional intelligence and maintaining a disciplined mindset are essential for overcoming these challenges.
Staying Updated with Market News
Impact of News on Crypto Charts
News plays a pivotal role in influencing cryptocurrency price movements. Positive news, such as regulatory approvals or mainstream adoption, often leads to bullish trends, while negative news, like security breaches or regulatory crackdowns, can trigger bearish trends. Analyzing historical data can help traders understand how different types of news have impacted crypto charts in the past, providing insights into potential future trends.
Using News as a Trading Strategy
Incorporating relevant news into a trading strategy involves developing a systematic approach to leverage breaking news for profitable trades. This includes setting up news alerts, understanding the market’s immediate reactions to news releases, and having predefined entry and exit points based on anticipated news outcomes.
Tools for Reading Crypto Charts
Online Platforms
Several online platforms cater to cryptocurrency traders seeking advanced charting tools. One prominent option is TradingView, offering a user-friendly interface with extensive charting capabilities. TradingView provides a wide range of technical indicators, drawing tools, and the ability to analyze multiple cryptocurrency pairs simultaneously. Additionally, it fosters a community where traders can share insights and strategies, enhancing the overall analytical experience.
Mobile Apps
For traders on the go, mobile apps play a crucial role. Coinbase and Binance, two widely used cryptocurrency exchanges, offer mobile apps with intuitive charting features. These apps allow users to monitor real-time price movements, draw trendlines, and apply various technical indicators directly from their smartphones. The convenience of accessing advanced charting tools on mobile devices empowers traders to make timely decisions wherever they are.
Advanced Charting Software
Professional traders often require more advanced analytical tools, and dedicated charting software like MetaTrader 4 (MT4) or MetaTrader 5 (MT5) caters to their needs. These platforms offer not only comprehensive charting capabilities but also automated trading through algorithmic strategies. Features include custom indicators, backtesting functionality, and the ability to execute complex trading strategies. Such sophisticated charting software empowers professionals to conduct in-depth analyses for precise decision-making in the dynamic cryptocurrency market.
Final Thoughts
In this comprehensive guide, we’ve covered essential elements of reading crypto charts, from basic chart types to advanced technical indicators. Armed with this knowledge, you are better equipped to navigate the crypto market and make informed decisions, ultimately empowering your trading journey.
FAQs
How often should I check crypto charts?
Regularly checking charts is advisable, but the frequency depends on your trading style and preferences.
Can I rely solely on technical analysis?
While technical analysis is valuable, combining it with fundamental analysis provides a more holistic view for decision-making.
What are the best timeframes for beginners?
Beginners often find success with longer timeframes, such as daily or weekly, to reduce noise and focus on broader trends.
How do I interpret a complex chart pattern?
Break down complex patterns into smaller components, focusing on individual candlestick indicators and their implications.
Is chart analysis suitable for long-term investments?
Chart analysis can be applied to long-term investments, but it’s essential to consider fundamental factors and market trends.