Cryptocurrency has taken the financial world by storm, and understanding how to read crypto charts is crucial for any investor. In this comprehensive guide, we will delve deep into the art of Secrets of master crypto charts with our comprehensive guide. Learn to analyze cryptocurrency trends and make informed investment decisions.
Table of Contents
- Reading Crypto Charts
- Common Mistakes to Avoid
- Frequently Asked Questions (FAQs)
- Q: Can I rely solely on crypto charts for investment decisions?
- Q: How often should I check crypto charts?
- Q: What’s the best time frame for crypto chart analysis?
- Q: Are there any free tools for crypto chart analysis?
- Q: Can reading crypto charts guarantee profits?
- Q: How do I stay updated on crypto market news?
- Conclusion
Reading Crypto Charts
Cryptocurrencies are known for their price volatility, and to navigate this volatile market successfully, it’s crucial to master the skill of reading crypto charts. These charts provide a visual representation of a cryptocurrency’s price movement over time.
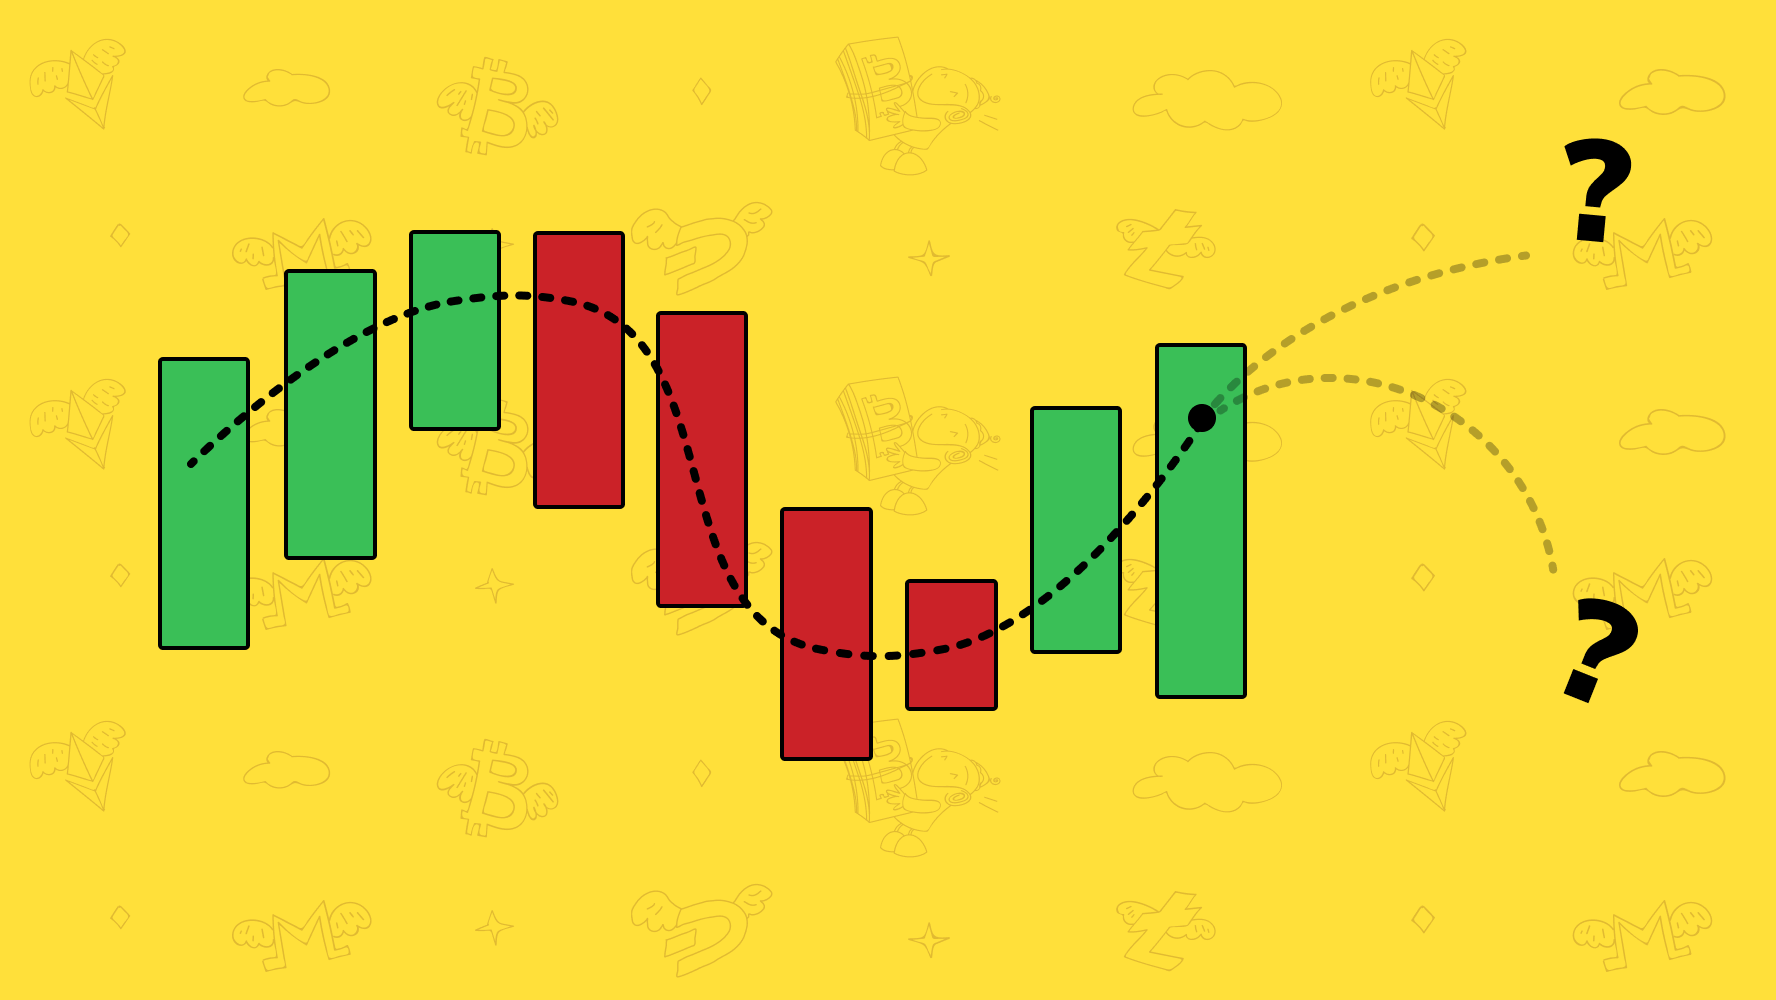
Crypto charts, often displayed as candlestick or line charts, graphically represent the historical price movements of cryptocurrencies. These charts show the price on the vertical axis and the time on the horizontal axis. By analyzing these charts, investors can gain valuable insights into how the price of a cryptocurrency has changed over time, helping them make informed decisions.
Candlestick Patterns
Candlestick patterns are essential in crypto chart analysis. They reveal market sentiment and can help predict future price movements. Understanding patterns like doji, hammer, and shooting star is crucial.
Candlestick patterns are a visual representation of price movements within a specific time frame (e.g., one hour or one day). Each candlestick has a “body” and “wicks” that indicate the opening, closing, highest, and lowest prices during that time frame. Various candlestick patterns, such as doji (indecision), hammer (bullish reversal), and shooting star (bearish reversal), provide insights into market sentiment. Traders use these patterns to anticipate potential price reversals.
Key Indicators
Crypto charts are laden with key indicators such as Relative Strength Index (RSI) and Moving Averages. These indicators provide valuable insights into market trends and potential reversals.
Key indicators are mathematical calculations based on historical price and volume data. They help traders and investors assess the overall market conditions and potential price direction. Two commonly used indicators mentioned are:
Relative Strength Index (RSI)
RSI measures the speed and change of price movements. An RSI above 70 indicates an overbought market, while below 30 suggests an oversold market.
RSI is a momentum oscillator that ranges from 0 to 100. It compares the magnitude of recent gains to recent losses, indicating whether a cryptocurrency is overbought (likely to decline) or oversold (likely to rise). An RSI above 70 suggests that the cryptocurrency may be overvalued and due for a price correction, while an RSI below 30 indicates potential undervaluation.
Moving Averages
Moving averages smooth out price data and help identify trends. The golden cross (short-term MA crossing above long-term MA) is a bullish signal, while the death cross (short-term MA crossing below long-term MA) is bearish.
Moving averages are trend-following indicators that calculate the average price over a specified number of periods. Traders commonly use two types: the short-term moving average (e.g., 50-day) and the long-term moving average (e.g., 200-day). When the short-term moving average crosses above the long-term moving average (golden cross), it can indicate the start of a bullish trend. Conversely, when the short-term moving average crosses below the long-term moving average (death cross), it may signal a bearish trend.
Common Mistakes to Avoid
When reading crypto charts, it’s easy to fall into traps. Here are some common mistakes to steer clear of:
To become a successful cryptocurrency trader or investor, it’s essential to avoid these common pitfalls:
- Ignoring Fundamental Analysis: Relying solely on charts without considering the underlying fundamentals of a cryptocurrency can lead to poor investment decisions. Factors like technology, team, and market adoption should also be evaluated.
- Overtrading: Making excessive trades based on minor price fluctuations can result in high transaction costs and increased risk. It’s crucial to have a clear trading strategy and avoid impulsive decisions.
- Neglecting Risk Management: Failing to set stop-loss orders or manage risk can lead to significant losses. Proper risk management is essential to protect your investments and limit potential downside.

Frequently Asked Questions (FAQs)
Q: Can I rely solely on crypto charts for investment decisions?
A: While charts are crucial, it’s essential to combine them with fundamental analysis for a well-rounded approach.
Q: How often should I check crypto charts?
A: Daily monitoring is common, but long-term investors may check less frequently.
Q: What’s the best time frame for crypto chart analysis?
A: The choice of time frame depends on your trading style. Short-term traders prefer shorter time frames, while long-term investors focus on daily or weekly charts.
Q: Are there any free tools for crypto chart analysis?
A: Yes, many online platforms offer free charting tools with essential indicators.
Q: Can reading crypto charts guarantee profits?
A: No, chart analysis is not foolproof. It’s one tool among many for making informed decisions.
Q: How do I stay updated on crypto market news?
A: Follow reputable cryptocurrency news websites and social media accounts for the latest updates.
Conclusion
Reading crypto charts is both an art and a science. It requires patience, practice, and a keen eye for detail. By mastering candlestick patterns, understanding key indicators, and avoiding common pitfalls, you can gain the expertise needed to navigate the exciting and ever-evolving world of cryptocurrencies.


